Reading Official Data Without Spin in 2026

A number can be accurate and still mislead you. National reports arrive as clean tables and confident headlines, but behind every figure sits a definition, a sample, a baseline and often a revision. None of that fits in a caption. If you repeat a statistic without checking those four things, you are trusting the person who chose them, whether or not they chose well.
Start with the definition
Most public arguments about data are really arguments about words. "Unemployment" may count people actively looking for work and exclude those who have given up. "Homelessness" may count only people in shelters on a single night. "Crime" may reflect reported incidents rather than incidents that occurred. Each choice is defensible, but the headline rarely carries it. Before you quote a figure, find the definition in the methodology note and ask whether the people you care about fall inside it.
Baselines decide the story
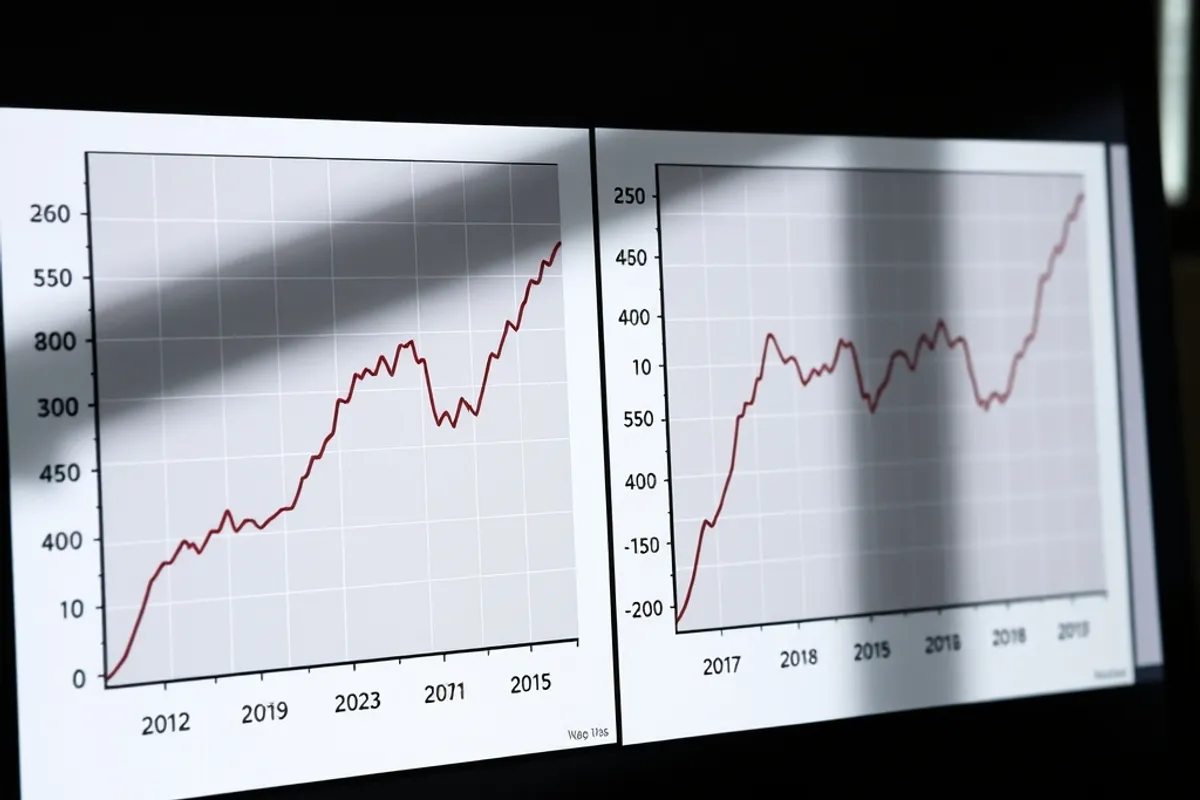
The same dataset can produce alarm or reassurance depending on the year you compare against. A rise from an unusually low year looks dramatic. A fall from an unusually high year looks like success. Good reporting names the comparison explicitly: "up 8 percent from last year, but still below the 2019 level." If a report does not name the baseline, that omission is information in itself.
Watch for charts that start at zero in some places and not others, and for totals that mix categories. A stacked bar can hide a decline in one group behind growth in another. The aggregate is not wrong; it is simply not the whole story. The original table usually separates the categories, and that is where the useful sentence lives.
Provisional numbers and revisions
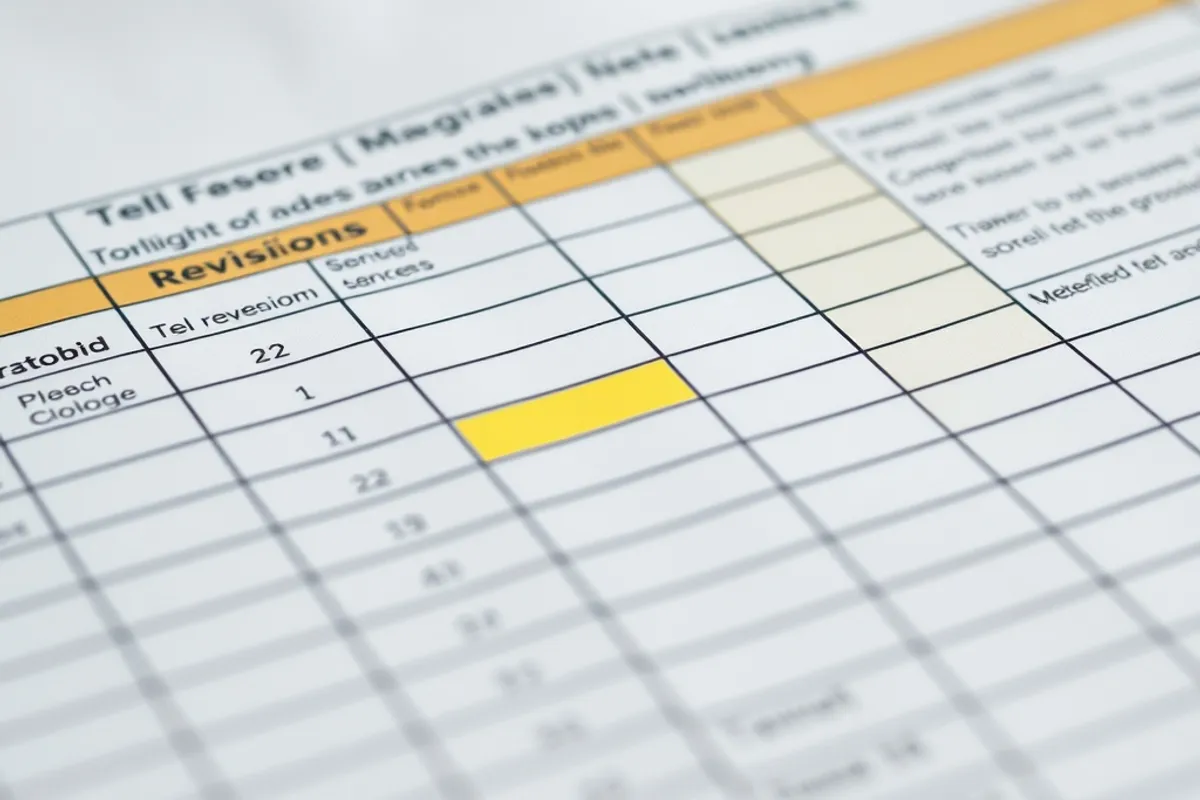
Many official series are published quickly and revised later. Early estimates can move by enough to reverse a headline. Check whether a figure is marked provisional, and look for the revision schedule. If a story relies on a number that will change next month, say so. Readers tolerate uncertainty far better than they tolerate being told a provisional figure was final.

Who collected it and why
Ask who produced the data and what they are required to measure. An agency may be legally obliged to report one thing and politically motivated to emphasize another. An industry body may publish a survey designed to support its members. That does not make the numbers false, but it tells you what to check. Independent replication, or at least a second source with a different incentive, is worth more than a confident press release.
Sample size matters more than precision suggests. A survey of 400 people can support a broad national claim only within a stated margin of error, which is often wider than the difference being reported. When the margin exceeds the change, the honest headline is that the change is not clear. That is a harder story to write and a more useful one to read.
"A statistic is a sentence with the context removed. Your job is to put the context back before you repeat it."
Reading the table, not the summary
Summaries are written by people with an interest in a clean narrative. Tables are less elegant and more honest. Open the original release, find the table behind the claim, and compare the row to the sentence. Check the units, the time period and whether the figure is a level or a rate. A rise in the number of cases alongside a falling rate per capita tells a different story than either figure alone.
Putting the number back into a story
Data becomes meaningful when it is attached to a person, a place and a decision. A national average may hide a local collapse. A small percentage of a large population may still be millions of people. The best reports move between the table and the street: here is the national figure, here is what it looks like in one town, here is who decides what happens next. That structure keeps the number honest without making it abstract.
When you cannot verify a figure, say what you know and what you do not. "The agency reports 12,000, a figure it describes as provisional" is more trustworthy than a bare number presented as settled. Readers notice the difference, and they reward it with attention.
The bottom line
Before you repeat a national statistic, check the definition, the baseline, the revision status and the source's incentive. Open the original table and read the row, not the summary. For more on how numbers become stories, see our guide to reading budget news and the rest of our National Reports section.